
See the Health of Your
Automation Program
NEW FROM WORKSOFT
Automation Insights helps enterprise testing leaders manage automation as a measurable program, with the evidence to set priorities, strengthen governance, and focus resources where they can have the greatest impact.
AUTOMATION PROGRAM INTELLIGENCE
Manage Automation With a Program-Level View
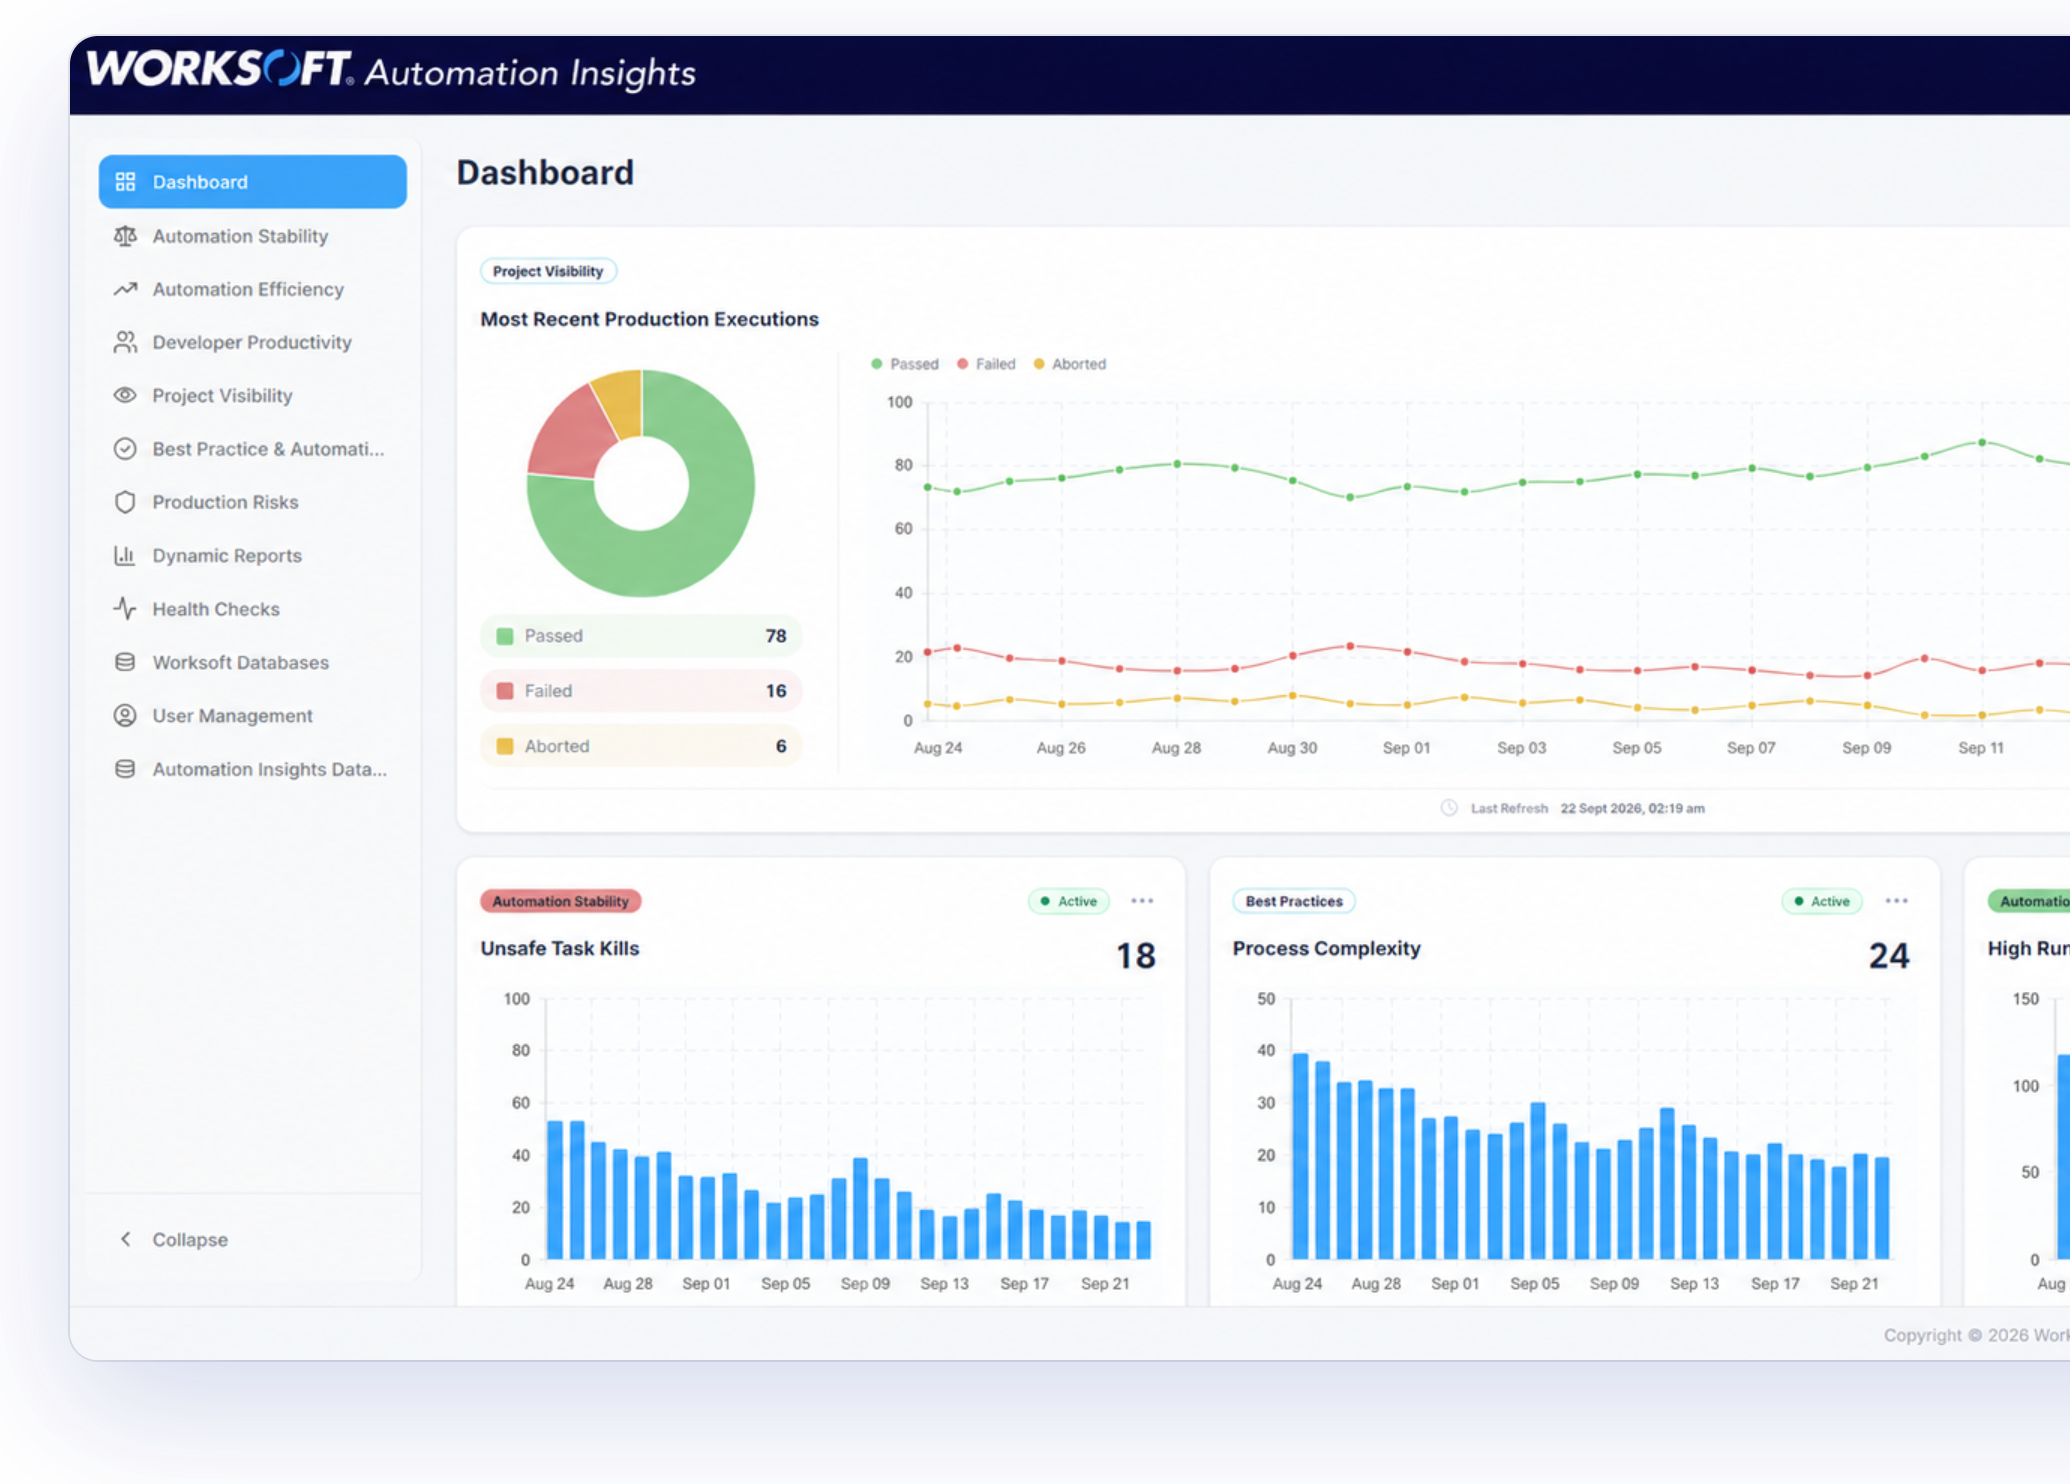
A growing automation program needs attention beyond individual pass-and-fail results. Long runtimes, persistent waits, unstable processes, stale assets, governance exceptions, and underused licenses can gradually affect performance even while tests continue to run.
Understanding those conditions over time allows teams to move from reactive maintenance to deliberate improvement. Leaders and practitioners can see where intervention will have the greatest effect and whether the program is becoming more stable, efficient, and consistent.
The Worksoft Approach
Worksoft Automation Insights examines more than 40 measures of automation health, performance, stability, governance, and utilization. Daily analysis, 30-day trends, and prioritized recommendations show where the program is improving, where attention is needed, and which actions can deliver the greatest operational value.
HOW AUTOMATION INSIGHTS WORKS
Turn Daily Automation Data Into a Clear Improvement Plan
Automation Insights gives automation leaders a shared view of program health, efficiency, stability, governance, and utilization. Instead of assembling status from execution logs and manual analysis, teams can monitor trends and identify the conditions that are limiting performance. Prioritized recommendations help teams address wasted runtime, unstable processes, stale assets, governance exceptions, and other program issues. The result is a more reliable automation program and a clearer basis for deciding where to improve it next.
01
Analyze Current Health
Evaluate automation assets and execution activity against measures that reveal inefficiency, instability, complexity, governance gaps, and underused capacity.
02
Reveal Patterns Over Time
Combine current findings with 30-day trends to distinguish isolated events from recurring conditions and see whether program health is improving.
03
Prioritize Improvement
Translate findings into recommendations that help teams focus attention, assign action, and track progress without manually assembling and interpreting reports.
Worksoft Automation Insights
Put Evidence Behind Every Program Decision
Most automation programs produce plenty of data and little clarity. Worksoft Automation Insights connects coverage, performance, and outcomes into a view teams and executives can share.
Real-Time Automation Coverage
See which parts of the automation library are stable, which aren’t, and where quality gaps or wasted effort build up. Teams direct effort toward the issues that matter most instead of spreading maintenance evenly across uneven risk.
Process Performance Visibility
Understand how automation performs across Certify projects, including where processes run reliably and where results or run times begin to drift. Surfacing instability early gives teams the chance to address it before it undermines confidence in test results.
Testing ROI You Can Defend
Connect testing effort to measurable outcomes, from portfolio growth to execution reliability and wasted run time. When leadership asks what the testing investment returns, the evidence is already in place rather than assembled after the fact.
Risk-Based Prioritization
See where automation carries the most fragility, from processes with shifting run times to design patterns that complicate maintenance. Remediation follows automation risk, so the issues that threaten reliability get attention first and effort isn’t spent on issues that carry little consequence.
Shared Visibility Across Stakeholders
Give QA leads, automation developers, and project managers a common view of automation health and performance. Secure access control and drill-down reports keep teams working from the same picture, so quality decisions reflect current results rather than competing versions of them.
Insight That Keeps Pace With Change
As automation libraries grow and change, Automation Insights refreshes on a schedule to keep stability, performance, and quality visibility current. Teams maintain an accurate view of automation health without rebuilding reporting every cycle.
Customer Stories
Trusted by Global Enterprises
Organizations running SAP, Oracle, Dynamics 365, and other enterprise systems rely on
Worksoft to validate critical business processes and reduce release risk. Customers across
manufacturing, telecommunications, energy, retail, and financial services use Worksoft to
accelerate transformation while maintaining confidence in system changes.
With Worksoft, even a non-technical person can understand the flow. It’s much easier to use than the other platforms we evaluated.
Worksoft beat the other automation platforms we evaluated hands down
By automating testing across large, complex, and highly customized applications that have evolved over many years, we have built a robust regression pack that rapidly identifies code issues and prevents defects from reaching production.
Worksoft is not only accelerating how we deliver change but is also enhancing quality, scalability, and efficiency across the organization.
Worksoft is very strong in the SAP environment, but you can also use it for non-SAP environments.
A manual automated ECS load would’ve taken us 17 days, whereas with the help of Worksoft’s automation, we were able to do it within four days.
We look at Worksoft as a tool that mitigates risk. We’re better equipped now to support the business at a faster pace.
Resources
Explore Smarter Testing in Action

RESEARCH REPORT
Testing in the Age of AI
AI is moving deeper into enterprise operations, but many organizations are still working out how to operationalize it at scale. A commissioned study conducted by Forrester Consulting on behalf of Worksoft.
eBook
Smarter Testing in a World of Continuous Change
This guide explores how Worksoft helps enterprise companies maintain business confidence throughout continuous change with its end-to-end testing platform.

Upgrade Guide
Plan Your Upgrade
Prepare your move to Worksoft 2026 with structured guidance, expert support, and a clear path to faster adoption and measurable results.
See It in Action
See What Your Automation Program Is Really Delivering
See how Automation Insights turns automation activity into a clear view of program health, stability, efficiency, governance, and utilization, then book time with our team to explore it in your environment.